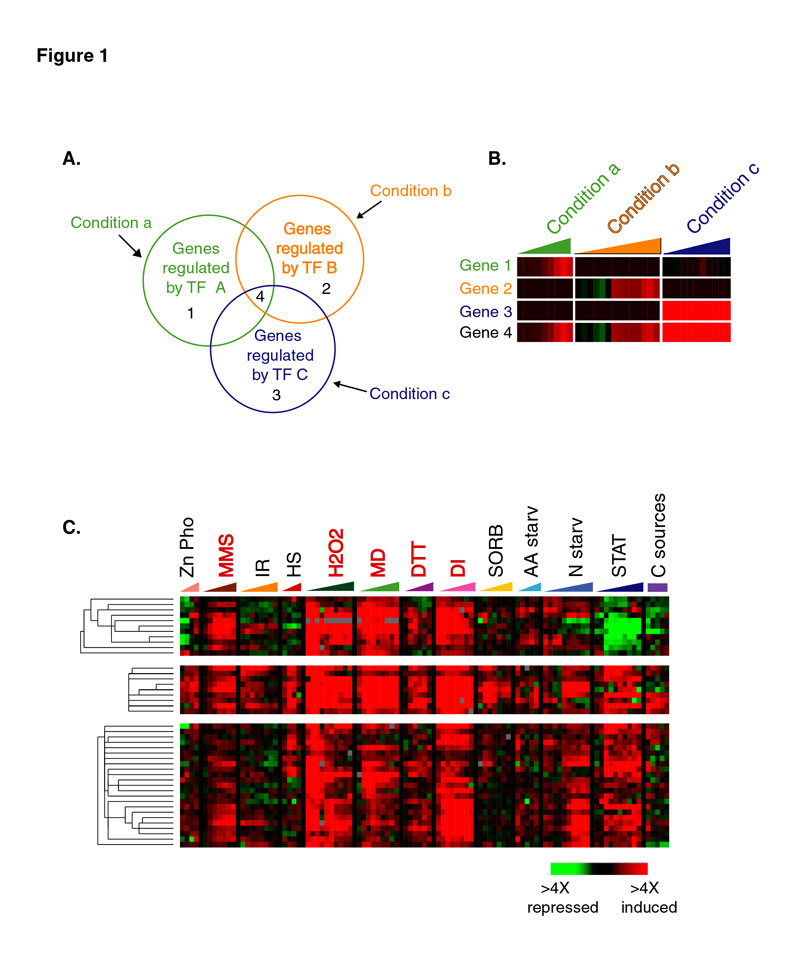
Figure 1. Many yeast genes are conditionally coregulated.
(A) The Venn diagram (left panel) represents hypothetical genes that are coregulated by transcript factor A (TF A) in response to condition a, transcription factor B (TF B) in response to condition b, or transcription factor C (TF C) in response to condition c. The regions of overlap in the diagram represent genes that are conditionally coregulated with the respective groups of genes (e.g. Gene 4).
(B) Hypothetical gene expression patterns for four representative genes in groups from (A) are shown and demonstrate that the expression pattern for Gene 4 has similarities with the expression patterns of each of the other genes. For this and other diagrams, gene expression data are represented in a colorized, tabular format in which each row indicates the relative transcript abundance for a given gene, and each column represents the relative transcript abundance for many genes as measured in one experiment. A red square indicates that a gene was induced in response to the condition listed, a green square indicates that a gene was repressed under those conditions, a black square indicates that there was no detectible change in expression, and a gray square represents missing data.
(C) The gene expression patterns of ~40 of the 70 known Yap1p targets are shown, as the genes appear in the complete, hierarchically clustered dataset. Because these genes were coordinately induced in response to only subsets of the conditions shown here (labeled in red), the entire set of Yap1p targets were assigned to multiple hierarchical clusters, the largest of which are shown here; the remaining Yap1p targets were assigned to other hierarchical clusters and are not shown in this display. The colored triangles above the figure represent the microarray timecourses that measured the changes in transcript abundance in response to zinc or phosphate limitation (Zn, Pho), treatment with methylmethane sulfonate (MMS), ionizing radiation (IR),heat shock (HS), hydrogen peroxide (H2O2), menadione (MD), dithiothreitol (DTT), diamide (DI), sorbitol (SORB), amino acid starvation (AA starv), nitrogen starvation (N starv), and progression into stationary phase (STAT); steady state gene expression was also measured for cells growing on alternative carbon sources (C sources), represented by the purple rectangle. See text for references.