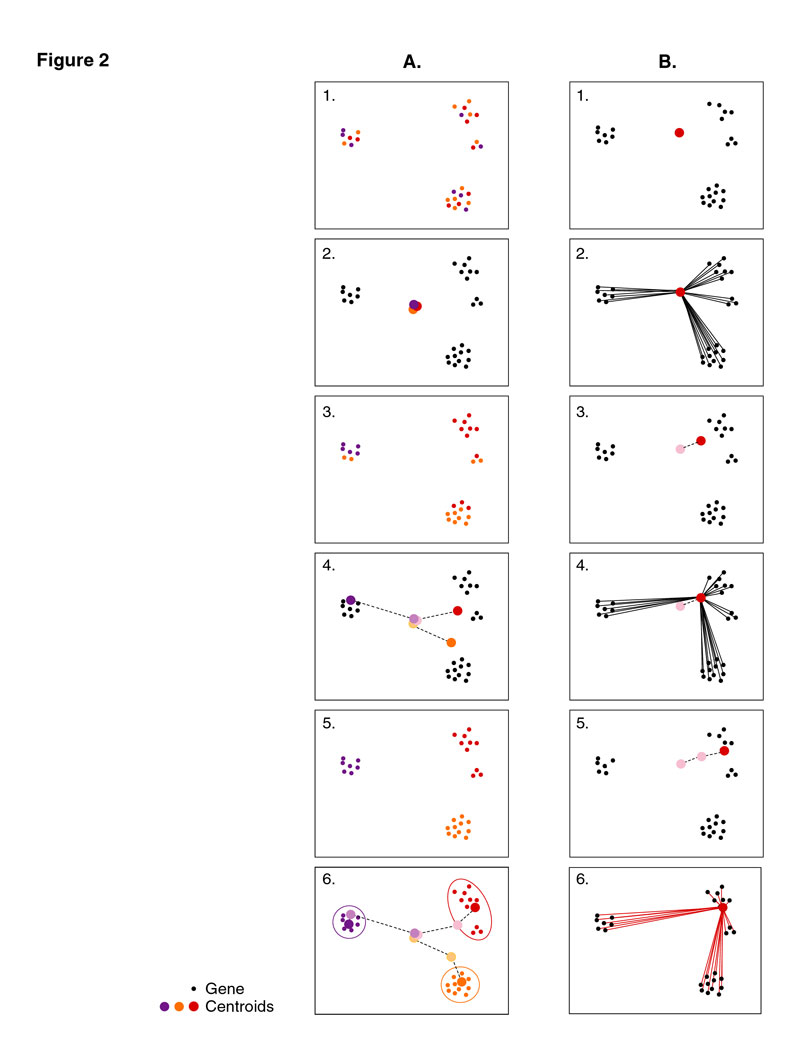
In these figures, the genes are represented as points in space, where genes that are similarly expressed are close together. (A) An overview of standard k-means clustering. (1) The process is initiated by randomly partitioning the genes (small circles) into 3 groups, indicated by the three colors. (2) The average expression profile of each group of genes is calculated as the centroid (large circles), and the genes are reassigned to the centroid to which they are closest. (4-6) Steps 2 and 3 are iterated until the centroids are stable, at which point the genes are assigned to the cluster to which they are most similar.
(B) An overview of fuzzy k-means clustering. (1) The process is initiated by seeding each centroid with an eigen vector identified by PCA, as shown here for one cluster (large circle). (2) For a given centroid, the membership of each gene is calculated based on the distance (or similarity) between each gene expression pattern and the centroid. (3) A new centroid is calculated as the weighted average of all of the gene expression patterns in the dataset, where each gene's weight is proportionate to its membership to the cluster: genes that are closer to the centroid will contribute more to the cluster mean, therefore the centroid position migrates toward those genes. (4-6) The process is iterated until convergence, and the membership of each gene to each cluster is calculated (as shown here for one centroid).