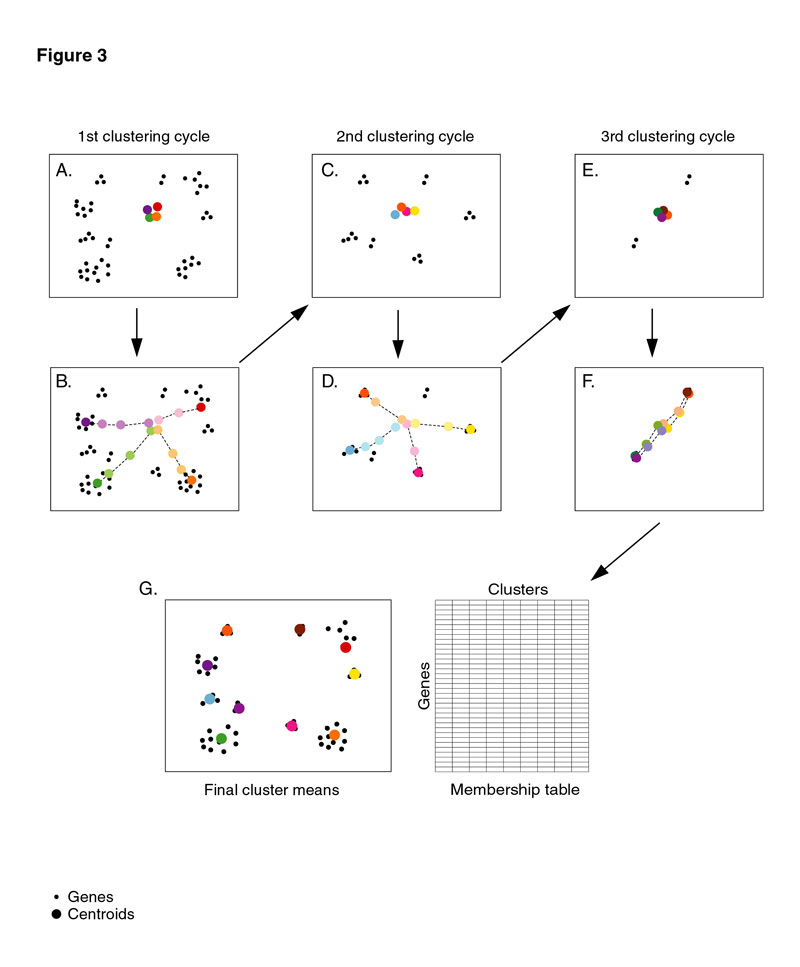
Genes are represented as points in space, where genes that are similarly expressed are close together. (A) (A) In the first fuzzy clustering cycle, k/3 centroids are defined as the most informative k/3 eigen vectors identified by PCA of the input dataset (large, colored circles). (B) The centroids are refined by iteratively calculating the gene-cluster memberships and updating the centroid positions until convergence (see Figure 2B). (C-D) Genes that are correlated >0.7 to the identified centroids are removed from the dataset, gene and array weights are recalculated, and the entire fuzzy k-means clustering process is repeated on the data subset for an additional k/3 clusters (see Materials and Methods for details). (E-F) Steps C-D are repeated for a third round of fuzzy clustering. (G) The output of the algorithm is a list of unique centroids and a table of gene-cluster memberships.