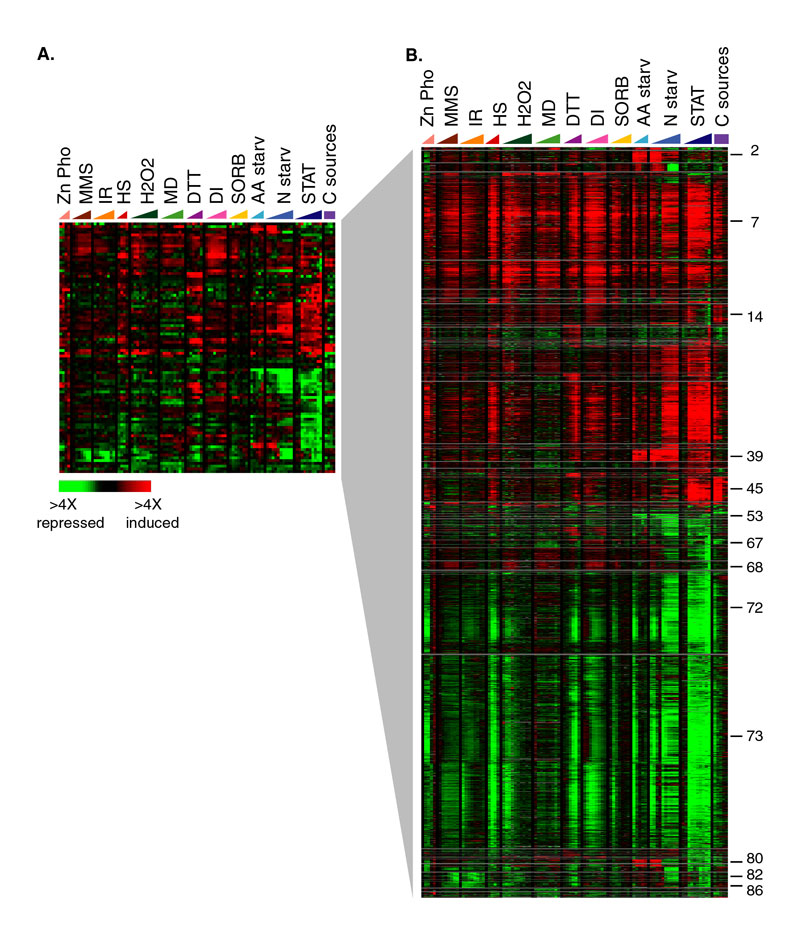
(A) Each row in this diagram represents one of the 91 centroids identified by fuzzy k-means clustering. The data representation and figure legend are the same as described in Figure 1. (B) Genes were assigned to each of the centroids shown in (A) using a membership cutoff of 0.08, as described in the text. Each cluster of selected genes is separated by a horizontal gray line. Examples of functionally related clusters of genes are indicated by numbers to the right of panel B: cluster 2, amino acid biosynthesis genes; cluster 7, genes induced as part of the environmental stress response; cluster 14, mitochondrial protein synthesis genes; cluster 39, genes involved in nitrogen utilization; cluster 45, oxidative phosphorylation and respiration components; cluster 53, specific amino acid transporters; cluster 67 glycolysis genes; cluster 68, proteasome components; cluster 72, secretion, protein synthesis, and membrane synthesis genes; cluster 73, genes repressed as part of the environmental stress response; cluster 80, amino acid biosynthesis genes; cluster 82, G2/M cyclins; cluster 86, histone genes. The complete clustering results can be viewed using FuzzyExplorer.