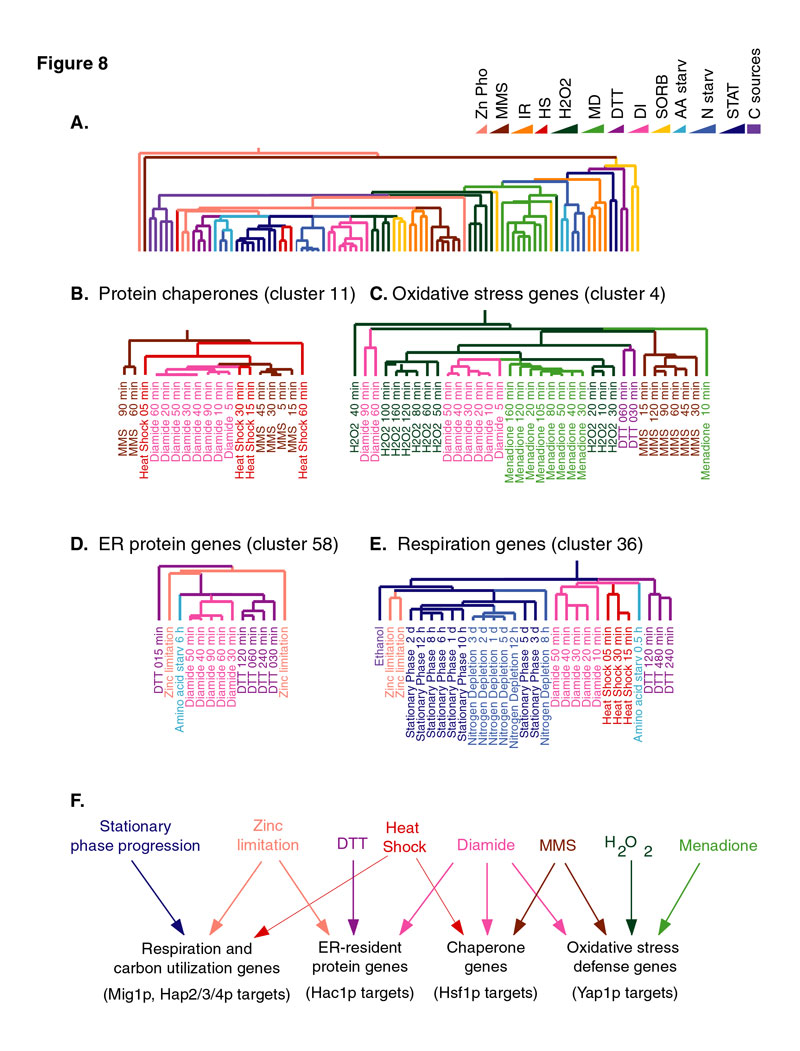
(A) The dendrogram generated by hierarchically clustering the experimental conditions based on all of the genes in the dataset is shown, as described in Materials and Methods. Each branch on the dendrogram represents one microarray experiment and is color-coded according to the key in the upper right corner. (B-E). Portions of the dendrograms generated by hierarchically clustering the experiments based on (B) protein folding chaperones and other genes assigned to cluster 11 (top 10 genes), (C) oxidative stress genes assigned to cluster 4 (top 24 genes), (D) UPR genes assigned to cluster 58 (33 genes), and (E) genes involved in respiration and carbon metabolism assigned to cluster 36 (96 genes). Each branch on the dendrogram represents on microarray experiment, as indicated by the text, and is color-coded according to the key. (F) A summary of the clustering results is shown, discussed in detail in the text, where each arrow indicates the induced expression of the respective gene set by the conditions indicated. The known regulators of genes represented in each cluster are also shown. View the complete dendrograms in B-E.