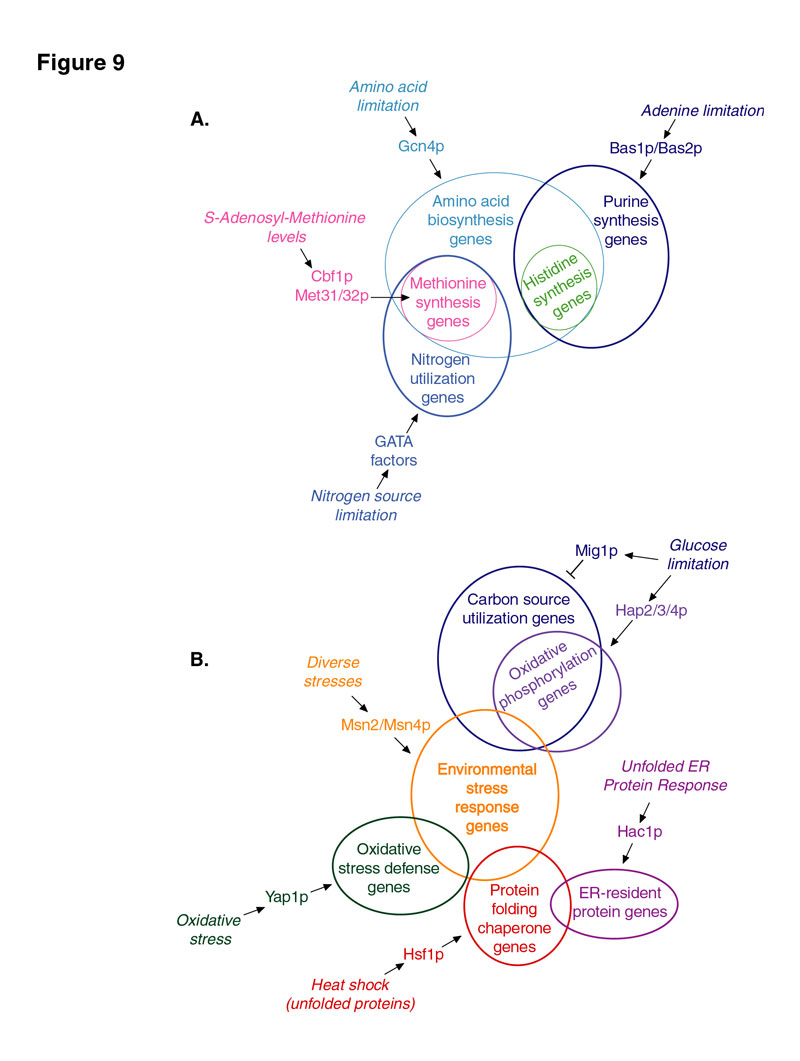
These diagrams provide a summary of the hypotheses presented in this work regarding the regulation of expression of genes that respond to amino acid and nitrogen source limitation (A) and to different environmental stresses (B). Each circle in the Venn diagram represents a cluster of genes that is enriched for the known binding site of the indicated transcription factor or is known to be regulated by the indicated factor in response to the denoted conditions.